You should be running reports in QuickBooks Online on a weekly—if not daily—basis. Here’s what you need to know.
You can do a lot of your accounting work in QuickBooks Online by generating reports. You can maintain your customer and vendor profiles. Create and send transactions like invoices and sales receipts, and record payments. Enter and pay bills. Create time records and coordinate projects. Track your mileage and, if you have employees, process payroll.
These activities help you document your daily financial workflow. But if you’re not using QuickBooks Online’s reports, you can’t know how individual elements of your business like sales and purchases are doing. And you don’t know how all of those individual pieces fit together to create a comprehensive picture of how your business is performing.
QuickBooks Online’s reports are plentiful. They’re customizable. They’re easy to create. And they’re critical to your understanding of your company’s financial state. They answer the small questions, like, How many widgets do I need to order?, and the larger, all-encompassing questions like, Will my business make a profit this year?.
Getting the Lay of the Land
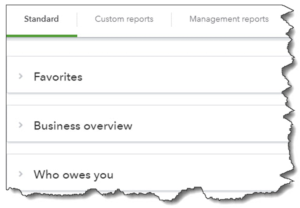
Let’s look at how reports are organized in QuickBooks Online. Click Reports in the toolbar. You’ll see they are divided into three areas that you can access by clicking the labeled tabs. Standard refers to the comprehensive list of reports that QuickBooks Online offers, displayed in related groups. Custom reports are reports that you’ve customized and saved so you can use the same format later. And Management reports are very flexible, specialized reports that can be used by company owners and managers.
A partial view of the list of QuickBooks Online’s Standard reports
Standard Reports
The Standard Reports area is where you’ll do most—if not all—of your reporting work. The list of available reports is divided into 10 categories. You’re most likely to spend most of your time in just a few of them, including:
- Favorites. You’ll be able to designate reports that you run often as Favorites and access them here, at the top of the list.
- Who owes you. These are your receivables You’ll come here when you need to know, for example, who is behind on making payments to you, how much individual customers owe you, and what billable charges and time haven’t been billed.
- Sales and customers. What’s selling and what’s not? What have individual customers been buying? Which customers have accumulated billable time?
- What you owe. These are your payables They tell you, for example, which bills you haven’t paid, the total amount of your unpaid bills (grouped by days past due), and your balances with individual vendors.
- Expenses and vendors. What have I purchased (grouped by vendor, product, or class)? What expenses have individual vendors incurred? Do I have any open purchase orders?
The Business Overview contains advanced financial reports that we can run and analyze for you. The same goes for the For my accountant reports. Sales tax, Employees, and Payroll will be important to you if they’re applicable for your company.
Working with Individual Reports
Each individual report in QuickBooks Online has three related task options.
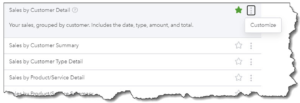
To open any report, you just click its title. If you want more information before you do that, just hover your cursor over the label. Click the question mark to see a brief description of the report. If you want to make the report a Favorite, click the star so it turns green. And clicking the three vertical dots opens the Customize link.
When you click the Customize link, a vertical panel slides out from the right, and the actual report is behind it, grayed out. Customization options vary from report to report. Some are quite complex, and others offer fewer options. The Sales by Customer Detail report, for example, provides a number of ways for you to modify the content of your report so it represents exactly the “slice” of data you want. So you can indicate your preferences in areas like:
- Report period
- Accounting method (cash or accrual)
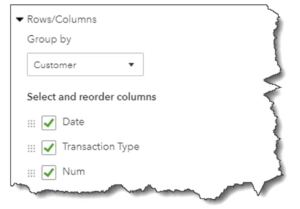
- Rows/columns (you can select which columns should appear and in what order, and group them by Account, Customer, Day, etc.)
- Filter (choose the data group you want represented from several options, including Transaction Type, Product/Service, Payment Method, and Sales Rep)
Once you’ve run the report, you can click Save customization in the upper right corner and complete the fields in the window that opens. Your modification options will then be available when you click Custom reports, so you can run it again anytime with fresh data.
You can customize QuickBooks Online’s reports in a variety of ways.
We’ll go into more depth about report customization in a future issue. For now, we encourage you to explore QuickBooks Online’s reports and their modification options so that you’re familiar with them and can put them to use anytime. Let us know if you have any questions about the site’s reports, or if you need help making your use of QuickBooks Online more effective and productive.
If you have any questions, please contact our office at (503) 224-5321. Isler Northwest LLC is a firm of business advisors and CPAs in Portland, Oregon. Our service goal at Isler Northwest is to earn our clients’ trust as their primary business and financial advisor.
Isler Northwest
1300 SW 5th Avenue
Suite 2900
Portland, Oregon 97201


